GridCraft: what it does and what to check first
A budget table should do more than display a believable total.
Last updated
Menus and supported features can change. Compare the source-check date below with your current app version.
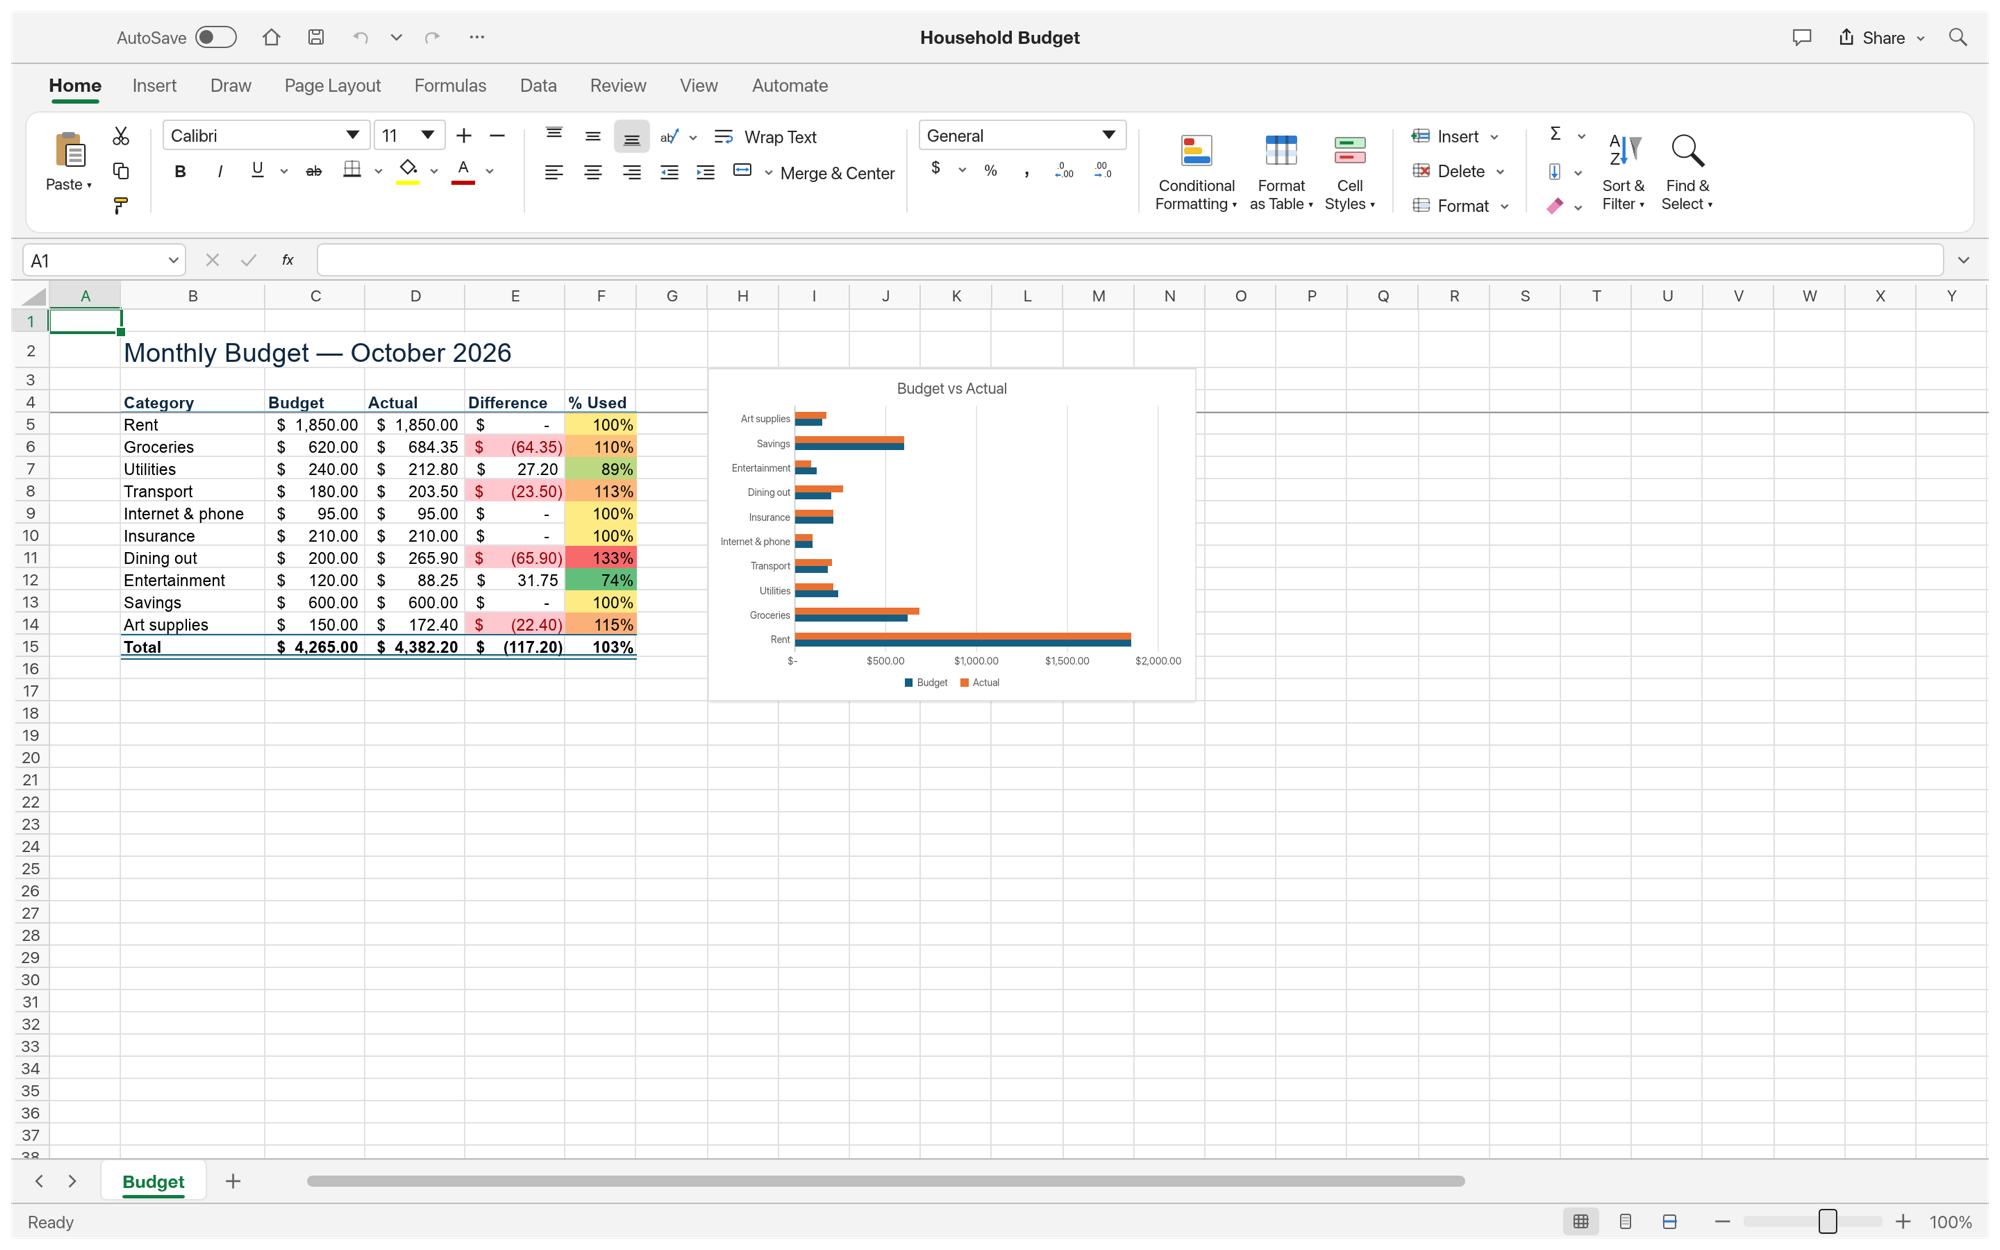
A budget table should do more than display a believable total. If spending changes, the differences and chart need to follow it. GridCraft is a spreadsheet app with formulas and workbook editing. I would begin with three rows whose answers we can check ourselves, then save, reopen and change one number. That tests continued calculation rather than just the first screenshot.
The checked material describes alpha / in development. I have read the public documentation; I have not installed and run this app for a hands-on review.
A look at the screen
| Where to look | What it does |
|---|---|
| Worksheet and formula entry | Keep numeric inputs separate from calculated results. |
| Home | Apply consistent number formatting. |
| Insert and chart controls | Check the chart’s source range before styling it. |
What the documentation describes
- The documentation describes formulas, conditional formatting, tables, charts and pivot tables for grouped summaries.
- XLSX-centred saving, CSV/TSV and some legacy-format reading are documented.
- Command-based editing and CLI/MCP paths can connect repeated workbook operations.
What interests me beside Excel
Repeated edits to a small table are interesting, but an Excel comparison needs separate checks for calculated results, original formulas, recalculation and charts. A workbook can show correct cached values yet fail to update after an edit. CSV also carries a different kind of result from an editable workbook with styles and charts.
The developer describes free, open-source, local work. Open source means the code is available to inspect. I have not measured a speed or total-cost advantage. For Excel, check the official product and plan information for the terms that apply in your region.
The limitation I would check first
The README lists real XLSX fidelity, large workbooks, recalculation and chart depth as areas for improvement. Some XLSB/ODS imports use cached values rather than original formulas. That can make a workbook appear correct on opening while losing the next calculation. Macros, external data and specialised formulas need checks beyond this small exercise.
A small first task
For the first exercise, let’s build a budget-versus-spending table. Prepare: Three budget rows: Food 300/340, Transport 120/100 and Subscriptions 50/50, where each pair is budget/spending.
Check the official app page and release downloads for a build matching your operating system and CPU. If there is no suitable installer or the app does not start, read Get started/Quick start and known issues in the official README. Record the app version and OS when you try the task.
The separate tutorial gives the menu sequence and an expected result. It is a documentation-based exercise, not a claim that I completed it. AI-assisted development, an app’s built-in AI features and an agent operating existing functions need to be distinguished when judging an automation claim.
Keep the working file and the delivery file
Keep an XLSX containing the formulas, not only a picture or cached totals. After reopening, change an input and inspect both its formula result and the aggregate. Check that conditional formatting and the chart still refer to the intended cells. A separate CSV can hold tabular values but should not be mistaken for the full styled, editable workbook.
If the result differs
If a formula appears as text, inspect cell format and any leading apostrophe. Locale settings can change decimal and argument separators; consult the formula-input documentation. For unchanged totals, inspect references and text-number inputs. For a misleading chart, check its range before its appearance, including whether the total row was included accidentally.
What I would verify before a bigger job
- Compare results and error cells for identical values and formulas.
- Inspect formulas, conditional formatting, charts and pivots in the same XLSX.
- Measure opening, recalculation and saving for the same large workbook.
Three rows with independently known answers make a useful first calculation check. They do not establish accuracy of a large workbook, advanced formulas, macros or external-data connections. Opening XLSB/ODS with plausible values is also not proof that its original formula logic survived.
Record the cell inputs, expected formulas and the second calculation after changing spending. For larger comparisons, use identical workbooks and measure opening, recalculation and saving separately. Inspect charts and styles after a round trip, and count errors rather than deciding from the table’s visual neatness.
Introduction · Task tutorial · Comparison: documented differences
Sources & further reading
- https://getartcraft.com/apps/gridcraft
- https://github.com/storytold/gridcraft/blob/main/README.md
- https://www.microsoft.com/en-us/microsoft-365/excel
- https://github.com/storytold/gridcraft/blob/84acf6293b1dc1fc09837524e035d674eb4d6741/README.md
- https://github.com/storytold/gridcraft/blob/84acf6293b1dc1fc09837524e035d674eb4d6741/crates/ui-egui/src/ribbon.rs
- https://github.com/storytold/gridcraft/blob/84acf6293b1dc1fc09837524e035d674eb4d6741/docs/formula-input.md